
Divorce Rates in America: Current 2026 Trends & Fact
The divorce rate was 2.4 per 1000 in December 2022. According to the CDC, the 2025 divorce rate is just 2.3 per 1000. However, since the information was submitted by 44 states and the District of Columbia only, the actual number across the country can be higher.
In 2026, the US divorce rate is hovering around a record-low 2.5 per 1,000 people, mostly because Gen Z is too exhausted to get married in the first place. While boomers are still leading the charge with “gray divorces,” the rest of you have managed to lower the failure rate to a slightly less embarrassing 42, a slight decrease from the traditional “50%” figure often cited in the past.
What Percent of Marriages End in Divorce
The divorce percentage in the U.S. has decreased compared to figures between the 1980s and 2000s. For instance, the current divorce rate per 1000 married women is 16.9, which was estimated at 22.8 forty years ago. Anyway, present-day divorce statistics are rather staggering:
- Approximately 50% of all marriages in the U.S. end in divorce or separation;
- About 41% of first marriages result in divorce;
- As for second marriages, this number rises to 60%;
- 73% of Americans married for the third time are likely to file for divorce.
Today, the U.S. is among the 15 countries with the highest divorce rate in the global chart.
U.S. Divorce and Marriage Rates by Year
The number of divorces in the U.S. is decreasing; however, the same tendency can be seen in marriage rates. For example, in 2019, the marriage rate was 8.2 per 1000 people; in 2020, this number lowered to 6.1 per 1000. The divorce rate was 4.0/1000 people in 2019 and declined to 2.7/1000 in 2020.
In 2021 and 2022, the marriage and divorce rate statistics were at low points. However, experts claim that it is challenging to estimate the real situation because many couples live together without getting married. In general, millennials wait longer before formalizing their relationships. However, they also get divorced more seldom than representatives of generation X, which has a direct impact on the lower rate of divorces which is currently 2.3 per 1000.
What is the Divorce Rate in the U.S. in 2021?

According to the data from the Census Bureau, the rate of divorce in America 2021 was 2.6/1000 people. It is almost identical to that in 2020 (2.7/1000 people).
Based on the National Center of Family and Marriage Research, the highest divorce rate in America 2021 percentage was in Arkansas. 21.7 per 1,000 married women reported getting divorced. The state with the lowest divorce rate in 2021 was New Hampshire, with 8.2 divorces per 1,000 married women.
What Is the Divorce Rate in the U.S. in 2022?
In 2022, the crude divorce rate in the U.S. was 2.4 per 1000 people. Though some specialists predicted that the situation with family separation would become worse due to the pandemic, the overall divorce rate dropped by 12% in the U.S.
Among married people aged 25-39 years old, over 60% of couples get divorced. Spouses between 40-49 years old terminated their marriages more rarely – about 34% of cases.
The Current Divorce Rate in America
The actual divorce rate in America is 2.3 per 1000 population. 66% of divorces are initiated by women. In some states, this number has increased to 75% over 5 years.
Psychologists have run multiple types of research and found out that only 27% of women regret breaking up with spouses. As for men, almost 40% state they feel depressed because of being estranged from a partner and children in particular.
Divorce Rate During Pandemic

It was expected by the American Community Survey (ACS) experts that the COVID divorce rate in the U.S. would rise. However, according to American Family Survey, 58% of married men and women from 18 to 55 started to value their relationships more. Besides, 51% of respondents indicated that their commitment to marriage became stronger.
While couples inevitably suffered from lockdown-caused stress, according to the Institute of Family Studies, the pandemic divorce rate in 2019 was surprisingly low, as only 14.9 per 1000 marriages ended in divorce. Moreover, the median duration of marriages in 2019 increased from 19 to 19.8 years.
While such COVID-19 pandemic divorce statistics may seem promising, the problem of domestic abuse has become extremely pressing. In the U.S., domestic violence increased by 8.1%, and sociologists believe this may cause an uptick in divorce rates in the following years when women will return to work and will be able to support themselves financially.
Military Divorce Rate & Statistics

The divorce rate in the army fluctuates between 3% and 3.4%. Typically, the number of divorces among female troops is much higher (approximately 7%) than that of male counterparts (2%). Besides, the divorce rate for enlisted troops equals 3.5%, while it is just 1.7% among officers regardless of gender.
As for army divisions, the lowest divorce rate is in the Navy (2.8%). It increases to 3.3% in the Air Force and the Marine Corps.
Pentagon has developed and implemented various programs to support military families. Anyway, the divorce rate among members of the U.S. army is slightly higher than the average national divorce number.
Highest Divorce Rates by Profession
There are various job-related factors that affect the stability and longevity of a marriage. In general, professions with the highest divorce rates are either those with a more relaxed workplace atmosphere (late nights, alcohol, and flirting possibilities) or those that are poorly paid. Below, you can see the list of the jobs with the highest divorce rate in America:
| Profession | Divorce rate |
| Gaming managers | 52.9% |
| Bartenders | 52.7% |
| Flight attendants | 50.5% |
| Gaming service workers | 50.3% |
| Rolling machine setters, operators, and tenders | 50.1% |
| Switchboard operators | 49.7% |
| Extruding and drawing machine setters, operators, and tenders | 49.6% |
| Telemarketers | 49.2% |
| Textile knitting and weaving machine operators and tenders | 48.9% |
| Extruding, forming, pressing, and compacting machine setters, operators, and tenders | 48.8% |
| Telephone operators | 47.8% |
| Massage therapists | 47.8% |
| Gaming cage workers | 47.3% |
| Licensed practical and licensed vocational nurses | 47% |
| First-line supervisors of correctional officers | 46.9% |
| Dancers and choreographers | 46.8% |
| Dispatchers | 46.6% |
| Textile winding, twisting, and drawing out machine operators | 46.5% |
| Ambulance drivers and attendants | 46.3% |
| Small engine mechanics | 46.2% |
The average divorce rate by industry from the lowest to the highest is the following:
| Industry | Divorce rate |
| Architecture and Engineering | 27.5% |
| Computers and Mathematics | 27.6 |
| Military | 28.3% |
| Gaming service workers | 50.3% |
| Life, Physical, and Social Science | 28.5% |
| Education and Library | 30.1% |
| Healthcare | 31.6% |
| Community and Social Services | 32.6% |
| Farming, Fishing, and Forestry | 33% |
| Finance | 33.9% |
| Legal | 35.1% |
| Arts and Entertainment | 35.3% |
| Management | 35.8% |
| Business Operations | 36.1% |
| Construction and Extraction | 36.6% |
| Extraction Workers | 37.4% |
| Food Preparation and Serving | 37.5% |
| Building and Grounds Cleaning | 37.9% |
| Sales | 38.3% |
| Production | 38.9% |
| Healthcare Support | 39.2% |
| Installation, Maintenance, and Repair Workers | 39.3% |
| Personal Care and Service | 39.6% |
| Protective Services | 40% |
| Transportation and Material Moving | 40.6% |
| Office and Administrative Support | 40.7% |
Though the divorce rates among people engaged in gaming and entertainment spheres are staggeringly high, they rise even more if one of the spouses is unemployed. Most American say that financial stability, a sufficient amount of time spent together, and marital traditions are very important for the well-being of their families. If one of these components is missing, the chances of divorcing are growing.
African Americans Divorce Rate
The black divorce rate in the USA is the highest among other races and equals 30.8%. Approximately 50% of all African Americans have never been married, compared to 34% of all Americans. This is the only ethical group where a divorce rate exceeds a marriage rate – 31 divorces/1000 married women compared to 17.3 marriages/1000 people.
According to the United States Census Bureau, African American males commonly get married at 32, while women register their relationships at 31. Besides, sociologists state that black men frequently marry white women, which can cause lower marriage rates among black women. For example, in 2021, only 85% of black men had black spouses. As for African-American women, almost 93% of them were married to black men. Though there is a propensity for African Americans to “marry out” their racial demographic group, the situation is gradually changing.
Same-Sex Divorce Statistics

On average, 1.6% of same-sex couples in America dissolve their legal relationships annually. Such a figure is lower than the annual rate of divorces among married different-sex couples. Besides, it is estimated that the gay divorce rate is lower than that of lesbians.
For example, in 2018, 900 same-sex couples ended their registered relationships in divorce. Almost 700 of those couples were lesbian. Based on the latest data, gay men account for 44% of same-sex marriages and make up only 26% of divorcees. The number of divorces among lesbians reaches 30%. One of the reasons for such figures is that lesbians tend to move quicker from dating to registering marriage than men. Lesbians also frequently have several marriages. About 18% of women who formed civil partnerships were divorcees, compared with 10% of men.
Divorce Statistics by Age and Cohort
According to the U.S. Census Bureau’s American Community Survey, the number of divorces per 1,000 people declines in each age group. Present-day age divorce statistics are like that:
- Ages 15-24: 27 divorces per 1000 people
- Ages 25-34: 23 divorces per 1000 people
- Ages 35-44: 21 divorces per 1000 people
- Ages 45-54: 18 divorces per 1000 people
- Ages 55-64: 12 divorces per 1000 people
- Ages 65+: 5 divorces per 1000
Moreover, 48% of those married before 18 are likely to divorce within 10 years. If people marry when they are 25+, only 25% of them may have to deal with marriage dissolution.
Experts believe that an age gap is one of the causes of divorce. For instance, couples with a 5-year gap are 18% more likely to divorce compared to spouses with a 1-year gap. The increase in the age gap has a direct impact on the growing chances of divorce. Thus, partners who are 10 years apart have a 39% chance of getting divorced, and those with 20 years between them face a 95% likelihood of divorce.
There is also such a phenomenon as gray divorce in the U.S. It refers to couples who are 50+ years old and decide to end their marriage. Though the divorce rates have been dropping in other age groups, the number of gray divorces has doubled in the last 20 years. The main reason for such a postponed decision is an “empty nest” syndrome. When grown-up children leave home, spouses may become confused and depressed because their parental mission is no longer front and center. The loss of purpose may prompt them to reevaluate their marriage and turn away from their spouses.
When Do People Divorce?
On average, marriages that end with divorce last 7-8 years. However, divorce rates by age married differ across American states. According to a recent study by the U.S. Census Bureau, the divorce rate is 50-65% in 14 states (Arkansas, Oklahoma, Nevada, and New Mexico, to name a few). In 12 states, the numbers fluctuate from 15% to 39%. The remaining states fall in between these figures.
According to statistical data, most families experience problems at similar stages in their spousal life. So, what are the hardest years of marriage? The first year is extremely challenging, and many psychologists call it a transition time. Even people who have already lived together before registering relationships claim that there appears to be another degree of commitment when they marry. Besides, they have to deal with various stressful things that can affect their marriage. Roughly speaking, 40-50% of marriages fail during the first year.
The third and fifth year is also highly risky. Usually, at this point, couples start thinking about having kids and need to accommodate their life to imminent changes. On average, 20% of families can’t handle the task and break up.
People who are married for 7-8 years frequently report decreasing interest in each other and growing anxiety from raising kids, taking care of a household, and earning money. Due to such issues, about 43% of couples decide to file for divorce.
To sum up, the success of marital life is undoubtedly dependent on the personal efforts of every couple; however, there are particular periods in married life when a divorce is most likely to occur, such as the first, third, fifth, seventh, or eighth year of marriage.
Most Common Reasons for Divorce in the United States

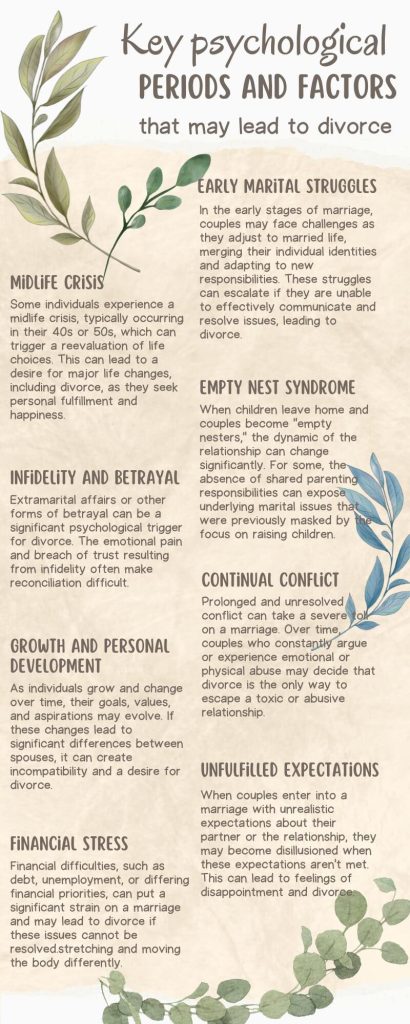
Experts from the CDC have interviewed multiple couples whose marriages failed and analyzed the data to define 8 leading causes for divorce.
- Incompatibility. Over 65% of people who lived through a divorce cited incompatibility as the biggest problem that induced them to leave a partner. They stated that being married to a person and spending lots of time in one place is totally different than seeing each other from time to time. When two adults have absolutely opposite approaches to life and aren’t ready to compromise, no marriage can succeed.
- Infidelity. Most participants of the poll stated that infidelity was a critical turning point in their relationships. Almost 60% of marriages are finished because one of the spouses cheated on a partner. Based on the study from the American Association for Marriage and Family Therapy, 25% of married men and 15% of married women had extramarital affairs. In most cases, such behavior was the most common reason for divorce.
- Constant quarrels. 57.7% of people said that family conflicts were so common and long-lasting that spousal life became unbearable. They didn’t manage to find a way out of regular wrangles and saw no other choice but to break their relations.
- Financial troubles. About 45% of respondents said that money-related issues weren’t the most pressing impetus for divorce but were a serious contributing factor. Due to different approaches to money distribution, saving, and spending, spouses experience huge stress and tension in the marriage.
- Unrealistic expectations concerning marriage. People whose marital life was disappointing usually regret getting married so young. Talking about “so young,” they mean 23 years old. 40% of Americans claim that at that age, their understanding of marriage was unreasonably rosy, and they couldn’t fully envision various twists and turns awaiting them. According to the Pew Research Center, the marriage age has changed radically over the past 50 years. For example, in the 1960s, almost 60% of people between 18-29 years old were married. In 2010, this number plummeted to 20%. One year later, men married for the first time when they were 28-29 years old. As for women, the median age for a first marriage was 26-27. If we recollect the situation in the 1950s, we’ll see that people registered their relationships in their early 20s.
- Addiction. 34.6% of individuals stated that substance abuse was a serious problem that eroded their marriage. However, this number represents the opinion of only one spouse that eventually initiated a divorce. As for both former partners who agreed that an addiction blighted their marriage, this percentage equals 33.3%.
- Domestic violence. 23.5% of survey participants defined physical and/or emotional abuse as the main destructive factor in their marriage. Still, they report that such a partner’s life-threatening behavior evolved and showed up over time, and there were periods of remorse. According to the United Nations Office on Drugs and Crime (UNDOC), over 50 thousand women who died because of domestic violence in 2017 were intentionally killed by a relative or a romantic partner.
- Health problems & weight gain. When people get married, they promise to live through turbulent periods of life hand in hand. However, it isn’t always the case, and health challenges may be a leading cause of breakup. The obesity problem is much discussed in American society, and it becomes even more perilous with each coming year. Currently, excess weight and other health problems lead to 18.2% of divorces.
Facts about Divorce Based on Statistics

Considering the numerical data presented above, it is possible to trace interesting changes in the U.S. marriage and divorce rates in the last decades.
1. People Are Marrying Later
The first notable trend is that most Americans, regardless of their ethnicity, decide to wait longer before they formalize their relationships. While in the 1950s, it was odd when a 21-year-old girl wasn’t married, nowadays, such an early marriage will rather evoke confusion. Psychologists name several reasons for such a shift.
First of all, twice more women than 30 years ago opt for studying at college. After graduation, they focus on finding a high-paid position, and after they feel financially secure, they think about finding a partner.
Another reason to marry later is divorce fear. If people saw their parents going through the separation process and remember the negative feeling they lived through in that period, they may be wary of similar experiences in their life.
One more thing that affects deferred marriage is the growing popularity of dating services. Thus, people can be in relationships without much responsibility and change partners whenever they want. Such an option is quite popular in modern American society, though it takes a toll on marriage rates.
2. Marriages Are Becoming Less Common
The attitude of Americans toward marriage has drastically changed over the last 30 years. For example, in 2006, about half of the U.S. adults believed it was extremely important to be legally married and raise kids together, and by 2022, this number lowered to 29%. To date, 40% of unmarried women give birth to babies and take care of them alone. In 1980, this number was twice lower.
The most common factors that have an impact on the dwindling importance of marriage are:
- reduced religious adherence to marriage;
- public disenchantment with married life;
- unstable jobs & financial stress.
3. Incompatibility Is the Leading Cause of Divorce in the U.S.
According to a recent study by CDFA, more than 60% of Americans reported that incompatibility destroyed their marriages. As for “incompatibility”, this concept can mean different things for different couples. Some partners discovered they had incompatible sex drives, career-life balancing approaches, parenting-related views, money-spending patterns, etc. Anyway, incompatibility was the basis for other problems that spurred people to separate.
4. Recent Divorce Rates Suggest a Decrease in the Number of People Dissolving Their Marriages

Though marriage rates have dropped noticeably, the same can be said about divorce numbers. Currently, there are fewer registered divorce cases in America than any year in a 50-year timeline. Undoubtedly, this may seem optimistic, but such statistics just barely describe a present-day situation.
Talking about divorces, it is necessary to consider that people get married later. Thus, they can be 28+ years old when they have their first marriage. In this age category, divorce rates are really lower because people treat spousal life more seriously, have better education and jobs, and can afford a more comfortable life. Thus, most divorce-driven factors are rather absent or smoothed out. Among younger couples (24 and younger), divorce rates are still high.
5. There is a Seasonal Spike in Divorces in the U.S.
The American Sociological Association conducted multiple studies to understand whether there is any particular period in the year when divorce rates differ from the rest of the time. According to the data collected, couples tend to break up more frequently in March and August.
Sociologists state that early summer and winter months are special times when families get together to celebrate holidays and have a rest, so it is considered inappropriate to file for divorce. But when there are no jovial preparations and sacred family events, people may decide to take the final step and end their marriage, especially if they have been pondering about it for a long time.
6. The Average Length of a Marriage in the U.S. Is 19.9 Years
Marriage duration increased over time, and now it is estimated at 19.9 years on average. Though 2019 was a stressful period due to COVID-related issues for most couples, it made many of them rethink the importance of marital life and become closer. Moreover, people approach marrying more carefully and are emotionally and financially mature when they register relationships. So, such marriages last longer.
7. More People in the U.S. Were Married in 2021 Than in 1960

The percentage of married couples in America in 1960 was 40.2. In 2021, this number increased to 61.45%. One of the reasons for such growth is that government allowed to register same-sex marriages. Another explanation is that there was an uptick in the overall population of the country.
8. Ages 28-32 Could Be the Best Time to Get Married
It takes time to get an education, find a good job, buy a house, and understand what you really want in this life. With this in mind, more and more Americans decide to postpone a decision to get married till they are 28+ years old. According to psychologists, this is a very smart choice because the divorce rate among adults getting married at older ages is noticeably lower as people can better understand their needs.
9. 23.5% of Marriages End in Divorce Due to Domestic Violence
Domestic violence is a pressing problem in U.S. society. 23.5% of people requesting a divorce stated that emotional and/or physical abuse was the main motive to leave their partners.
10. U.S. Divorce Rates Are Higher than Those of Other Countries
Divorce rates in America are high. The U.S. is among the top 15 countries considering this parameter. Currently, divorce figures slightly lowered to 2.3 per 1000 people, and the country occupies 13th place in the global table.
Top Countries with the Highest Divorce Rates in the World
To calculate a divorce rate by country, experts divide the number of divorces in a specific year by the total population. Thus, they get a crude divorce rate. Typically, the resulting figure is expressed as a number per 1000 people.
The top 13 countries with the highest divorce rate in the world are:
| № | Country | Divorce Rate |
| 1. | Maldives | 5.52 |
| 2. | Kazakhstan | 4.6 |
| 3. | Russia | 3.9 |
| 4. | Belarus | 3.7 |
| 5. | Belgium | 3.7 |
| 6. | Moldova | 3.3 |
| 7. | China | 3.2 |
| 8. | Cuba | 2.9 |
| 9. | Ukraine | 2.88 |
| 10. | Denmark | 2.7 |
| 11. | Latvia | 2.6 |
| 12. | Lithuania | 2.5 |
| 13. | United States | 2.3 |
Based on the data collected and processed by United Nations, the highest divorce rate in the world is in the Maldives. It may be due to the fact that in this island country, the legal procedure of marrying somebody and applying for divorce is very simple and quick. Besides, women in this region and globally alike have become more independent and can earn enough money themselves.
Sources
- CDC. Marriage and Divorce
- PEW Research Center. Led by Baby Boomers, divorce rates climb for America’s 50+ population
- United Nations. World Marriage Data 2019
- Institute for Divorce Financial Analysts
- Department of Health. Dissolutions of Marriage by Duration and Type of Decree by Region
- National Health Statistics Reports
- National Center for Family and Marriage Research
- Provisional number of marriages and marriage rate: United States, 2000-2021
- Institute for Family Studies
- BGSU. Marriage, Divorce, and the COVID-19 Pandemic in the U.S.
- IPUMS USA
- U.S. Census Bureau. Number, Timing, and Duration of Marriages and Divorces
- U.S. Census Bureau. Characteristics of Adults in Same-Sex and Opposite-Sex Couples by State
- United Nations. Demographic and Social Statistics. Divorce
- OECD. Marriage and divorce rates
- UNODC. Global study of homicide.
- Pew Research Center. Same-Sex Marriage Around the World
- University of Washington. Is divorce seasonal?
Online Divorce Made Simple
Complete your divorce forms through a simple, guided process designed for your state. No lawyers, no court stress.